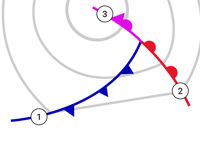
Measured pressure distribution at MSL and corresponding frontal systems are displayed on which chart?
Refer to figure.
Surface weather charts illustrate the weather patterns at ground level and are published by the meteorological services of each state.
The surface weather chart provides detailed information about weather conditions at the Earth's surface, including pressure patterns and frontal situations. These charts show the surface pressure pattern using isobars (lines of equal pressure) and indicate areas of high (H) and low pressure (L) along with their central pressure value. Isobars are represented by solid lines. High pressure is usually associated with settled weather while low pressure is normally associated with unsettled weather. Fronts are also displayed.
The geostrophic wind scale is provided in the top left corner and may be used to measure weind speeds.
Your Notes (not visible to others)
This question has appeared on the real examination, you can find the related countries below.
-
Austro Control1
-
Czech Republic1