

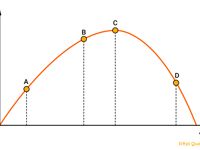
Refer to figure.
What is the point on the graph, where the level of arousal is optimum?
P = Performance
A = Arousal / Stress
Refer to figure.
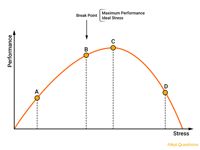
STRESS/AROUSAL AND PERFORMANCE
The figure indicates the relationship between stress and performance. The graph has the shape of an inverted U. The graph shows that performance improves with increased stress or arousal up to a certain optimum point called the 'break point', after which it declines as stress levels continue to rise.
Therefore it can be noted that:
- Low stress or arousal levels lead to poor performance. Individuals may feel bored, disengaged, or unmotivated.
- Medium stress or arousal levels lead to optimum performance (the break point). Individuals experience heightened alertness, focus, and energy. This optimal arousal leads to improved concentration, decision-making, and efficiency, resulting in peak performance.
- High stress levels or arousal lead to poor performance. When stress levels become too high, it leads to anxiety, panic, and cognitive overload. High stress impairs cognitive functions such as memory, attention, and problem-solving abilities.
Note: The correct answer is ‘Point B’ based on student feedback. Most probably the examiner believes that at point C the performance has already started to degrade, so the optimum performance occurs just before that point.
Your Notes (not visible to others)
This question has appeared on the real examination, you can find the related countries below.
-
Austro Control5
-
Greece3
-
Romania3
-
Ireland1
-
Luxembourg1
-
Malta1


