

The true heading (TH) of an aircraft is 250°. If it flies with a ground speed (GS) of 120 kt and the current wind is 010°/30 kt, what is the true course (TC) of the aircraft?
Refer to figure.
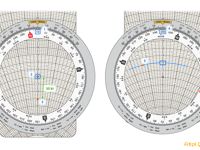
For this calcunation use the wind side of your flight/navigation computer (see the steps in the figure):
- Set the wind direction of 010° under the True Index.
- Set the ground speed of 120 kt at the center point.
- Mark wind velocity 30 kt down from centre point. (Tip: When the true course is asked, we mark the wind speed down from the center point. When the true heading is asked, we mark the wind speed up from the center point.)
- Set the true heading of 250° under the True Index.
- Slide wind velocity mark to GS of 120 kt.
- Read the drift of 13° left.
Drift is the angle difference between the Heading and the Track or Course, so a 13° left drift means that the true course has a direction of 13° left of the true heading.
- True Course = True Heading - Drift = 250° - 13° = 237°
Note: If the drift is to the right we have to add it to the true heading to find the true course. If the drift is to the left we have to substract it from the true heading to get the true course.
Right Drift: True Course = True Heading + Drift
Left Drift: True Course = True Heading - Drift
Your Notes (not visible to others)
This question has appeared on the real examination, you can find the related countries below.
-
Austro Control1


