

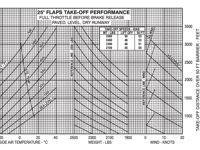
Refer to figure.
Using the Take-off Performance chart, what is the approximate TO distance over a 50 ft obstacle?
Pressure Altitude = 3500 ft
OAT = ISA
Weight = 2500 lbs
3 kt tailwind
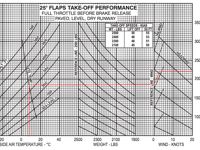
Refer to figure.
The chart is entered by following the STD temp line, and a vertical line is projected upward to the 3500 ft pressure altitude curve, which sits between the 3000 ft and 4000 ft lines.
A horizontal line is then drawn across to the weight reference line at 2500 lbs, which in this case requires no weight adjustment since 2500 lbs is the reference weight itself.
The horizontal projection continues into the wind section of the chart, where a 3 kt tailwind is applied by tracing down along the tailwind diagonal lines.
The resulting value read from the distance axis is approximately 2200 ft.
Your Notes (not visible to others)
This question has appeared on the real examination, you can find the related countries below.


 Use Keyboard Shortcuts
