

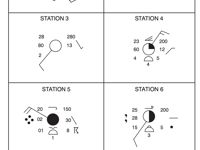
Refer to figure.
Using the synoptic model of Station 1, what is the atmospheric pressure (QNH) reported at this station?
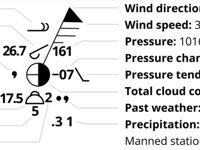
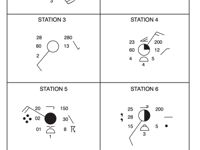
Refer to figures.
On a WMO synoptic plot, the mean sea level pressure (PPP) is plotted on the upper right side of the station circle, encoded on three digits in tenths of hPa, with only the last three significant digits shown.
To decode the full pressure value, the reader must remember that the leading digit is implicit: if the plotted three digit number is between 000 and 499, it corresponds to a value preceded by 10 (so the decoded pressure lies between 1000.0 and 1049.9 hPa), and if the plotted number is between 500 and 999, it is preceded by 9 (so the decoded pressure lies between 950.0 and 999.9 hPa). The three digits are read as the last three figures including the tenth of hPa.
At Station 1, the upper right figure of the circle is 220. Applying the rule, since 220 is less than 500, a leading 1 is added, giving 1220. The last digit is the tenths of hPa, so the decoded pressure is 1022.0 hPa.
Your Notes (not visible to others)
This question has appeared on the real examination, you can find the related countries below.


 Use Keyboard Shortcuts
